
Target (TGT) Could be Attempting to Reverse Bear Trend
A Clear Bearish Channel observed in Target after Price Hit All Time Highs

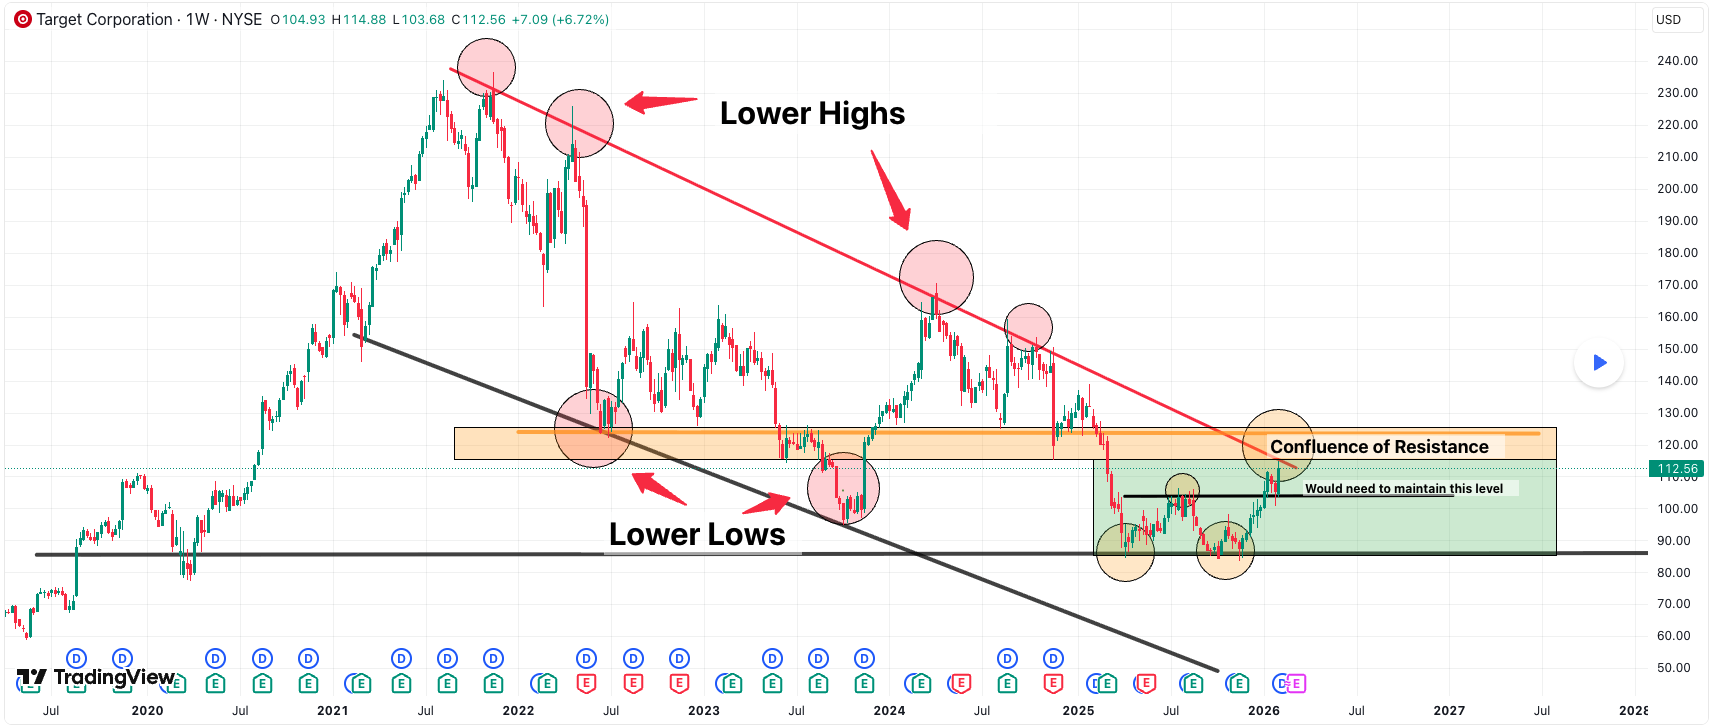
This is an analysis of the 1 Week or Macro timeframe. We zoom out to get a feel for the big picture moves.
Where Target's current price action has reached, it warrants attention and to me is a critical area to watch.
Why critical? Well, we have reached the Upper bounds of Targets Bearish Channel so we either attempt for a break of the resistance holding us down or we continue the Bearish trend downwards.
Why Bearish channel or trend? Because technical analysis 101 says that the observation of Lower Highs and Lower Lows are indicative of a bearish trend.
It can't be any clearer. With this established, its always important to remember:
The Trend Is Your Friend.
Probabilities dictate that price action will continue to move in the direction of the established trend. Until ofcourse it doesn't by printing reversal signs/ signals, etc.
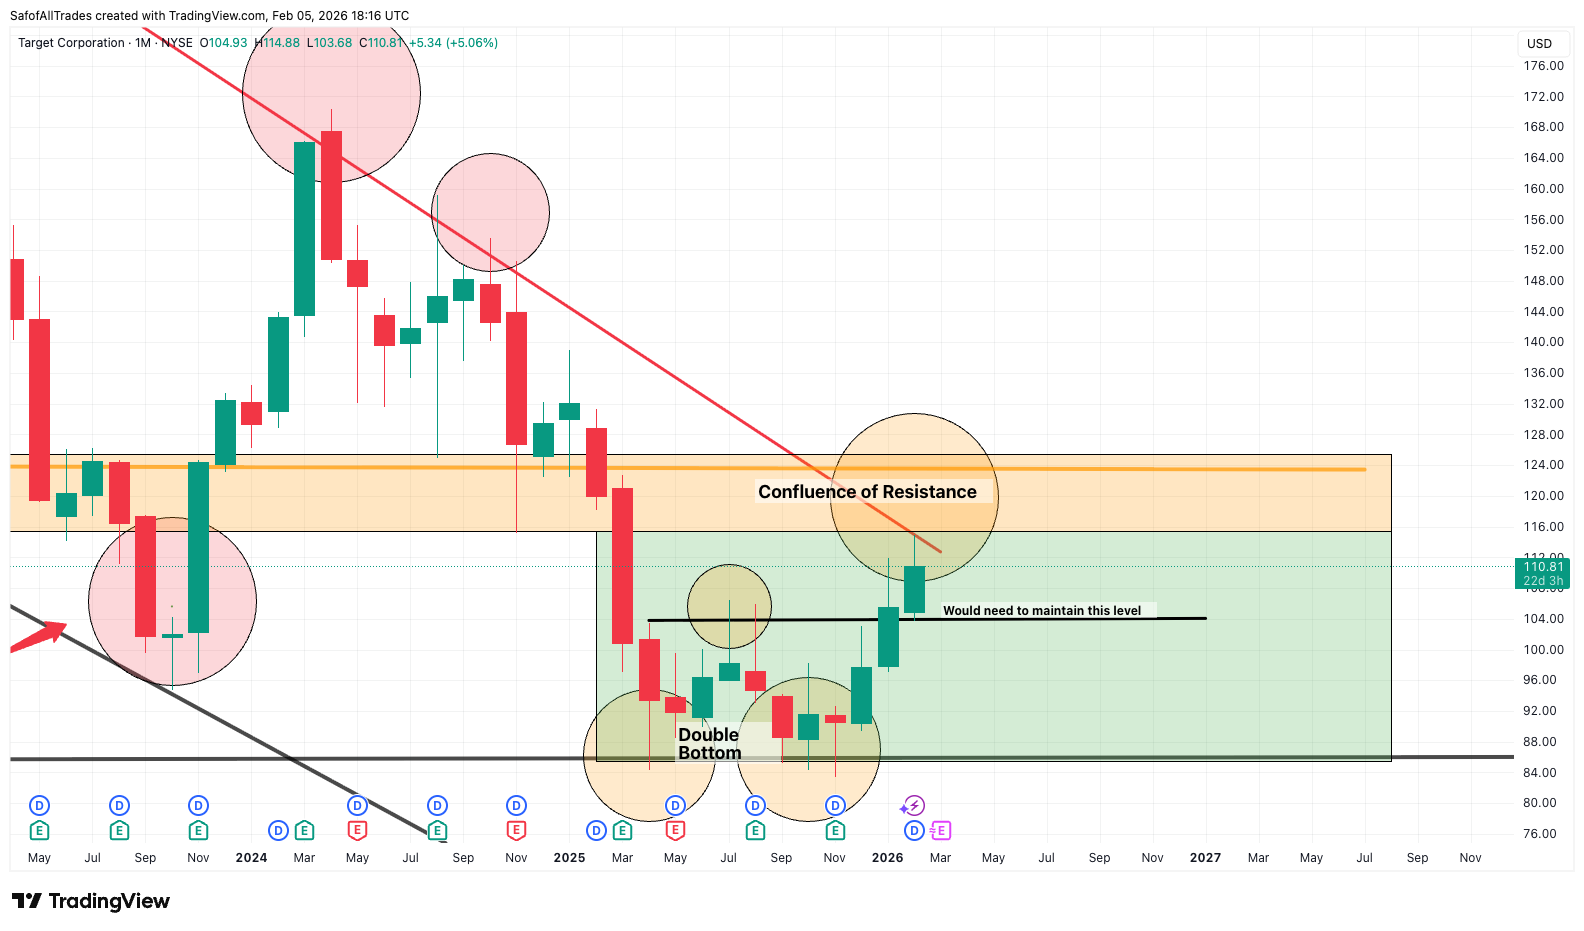
Notice the Green rectangle highlighting the Price action of the last 10 months-ish.
In April 2025, we reached a price of around $86.00, bounced from here to around $105.00 and again fell back down to around $86.00 in the Fall of 2025.
Reaching $86.00 twice, is a Double bottom formation. A potential sign of an attempt to reverse trend.
Now in recent Price Action we are currently around $112.00. This is our first Higher high since we began our Bearish trend in October 2021.
The Green Zone can also potentially becoming a multi year consolidation range.
Which is why again i would say is a critical area and warrants attention.
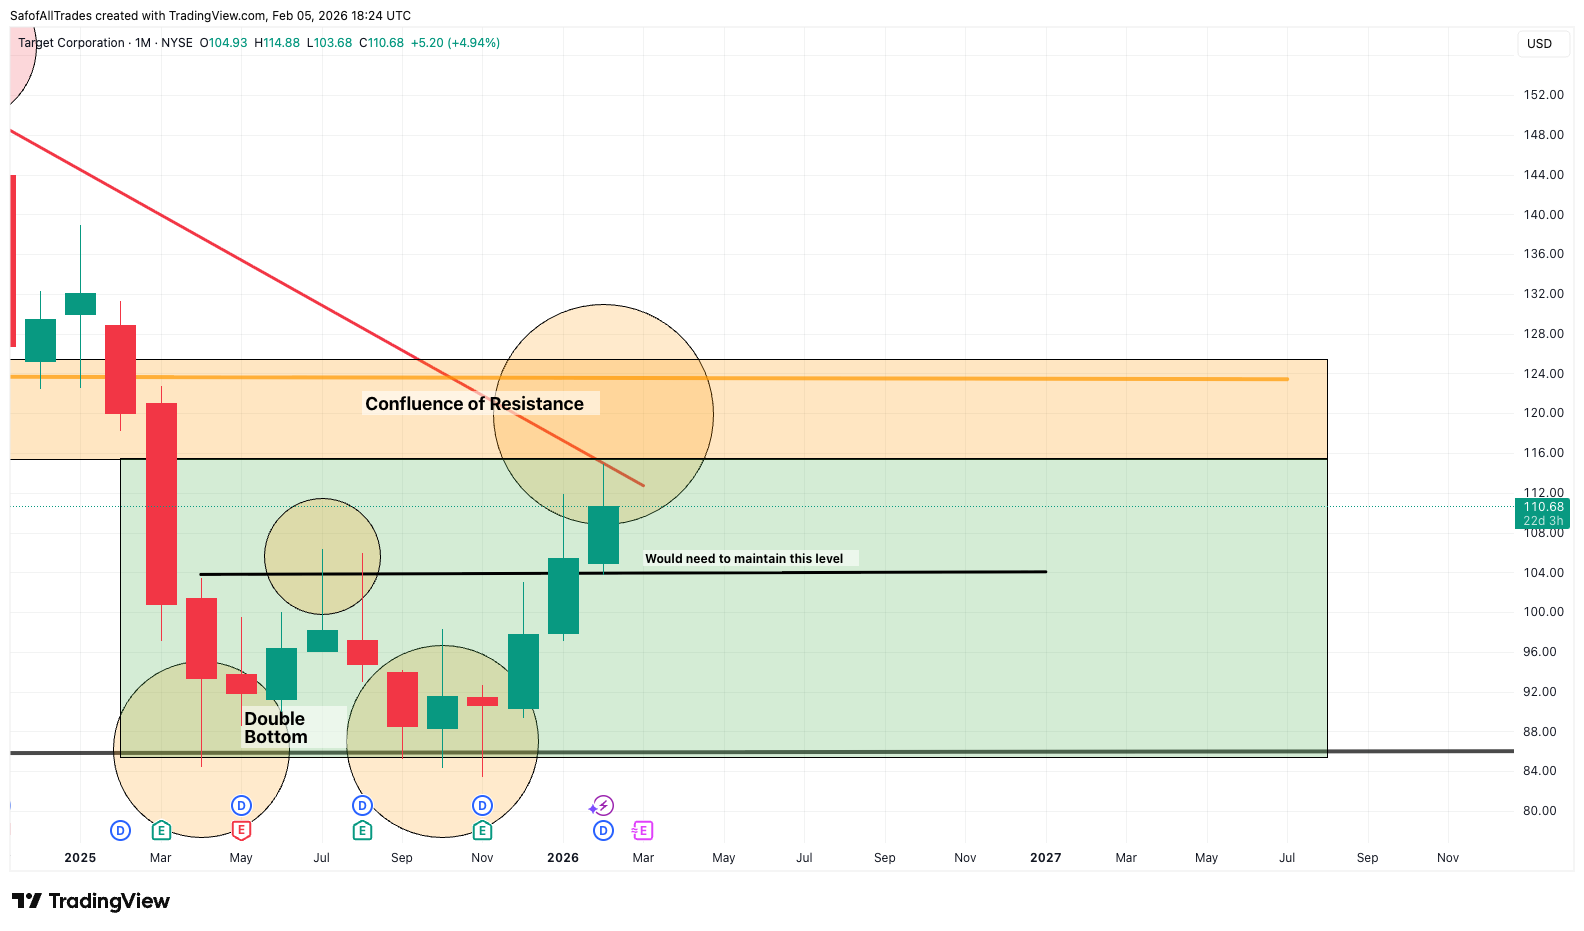
Zoom in on current price action and “Confluence of Resistance”
What i'm looking to see is how price action interacts with this current price zone highlighted in Orange, titled "Confluence of Resistance". Its not going to be easy as people will look to unload stock, as many have held stock since the highs of $231.00.
A clear sign that Bullish Trend is getting stronger is if we break above the Red Resistance Trend line and Confirm Support and show clear signs of moving above the Orange zone as well.
Another sign would be a clear Higher Low Print.
But do keep in mind, probabilities point to Current Trend Continuing unless features of current trend shows a major shift in demand.