
Godaddy’s Weak Macro Market Structure lead Downtrend
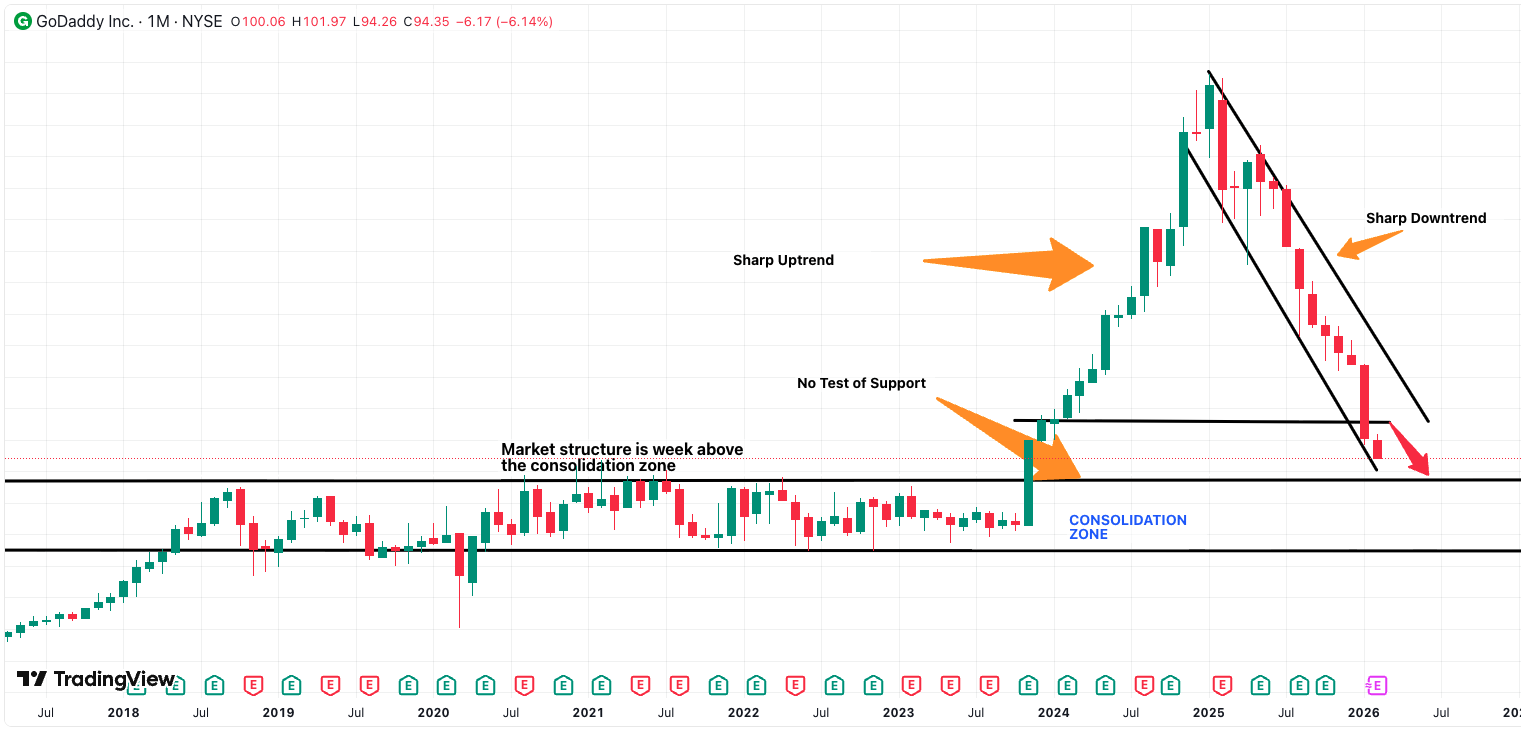
Observance of a Sharp Price Uptrend followed by a Sharp Price Downtrend in Godaddy
This is an analysis of the Macro structure of Godaddy on 1 Month timeframe.
The current move is as clear as day. It is highly probable that we retrace back to the breakout of the consolidation range (Rectangle pattern).
Price action Bearish momentum is strongly indicated by January Large Bodied bearish candle.
With how weak the market structure is with no clear support levels above the Consolidation breakout level of around $87.00. It is likely we test Support here.
And that is why an important sign to consider is that of confirmation and test of support at breakout point. Sometimes having price action stall for some time before continuing breakout. This is good characteristic of strong market structure created from health supply/ demand interactions.
The Uptrend to Godaddy's High of roughly $215.00 was a powerful move but an extreme one when considering market structure.
With the long consolidation or range bound movement of price action for around 5 years between $55.00 and $87.00. It really allowed for momentum to build up.
BUT sharp moves up without healthy pullbacks/ range bound movements/ signs of testing support along the way up in terms of market structure in the long run creates weak market structure.
Steady moves up with pull backs and less sharpness or verticality of the move, the better it is for the long term of the structure created by price action. You can think of support tests/ specific areas where price stalls or pull backs as safety nets. If price action (candles) don't linger or pull back safety net will not be created.
This is WHY we are seeing the same sharp Downtrend move as we did during Uptrend.