
Coinbase Textbook Bottoming Pattern Found
Observation of a Bottoming Pattern : Inverse Head and Shoulder in COIN.
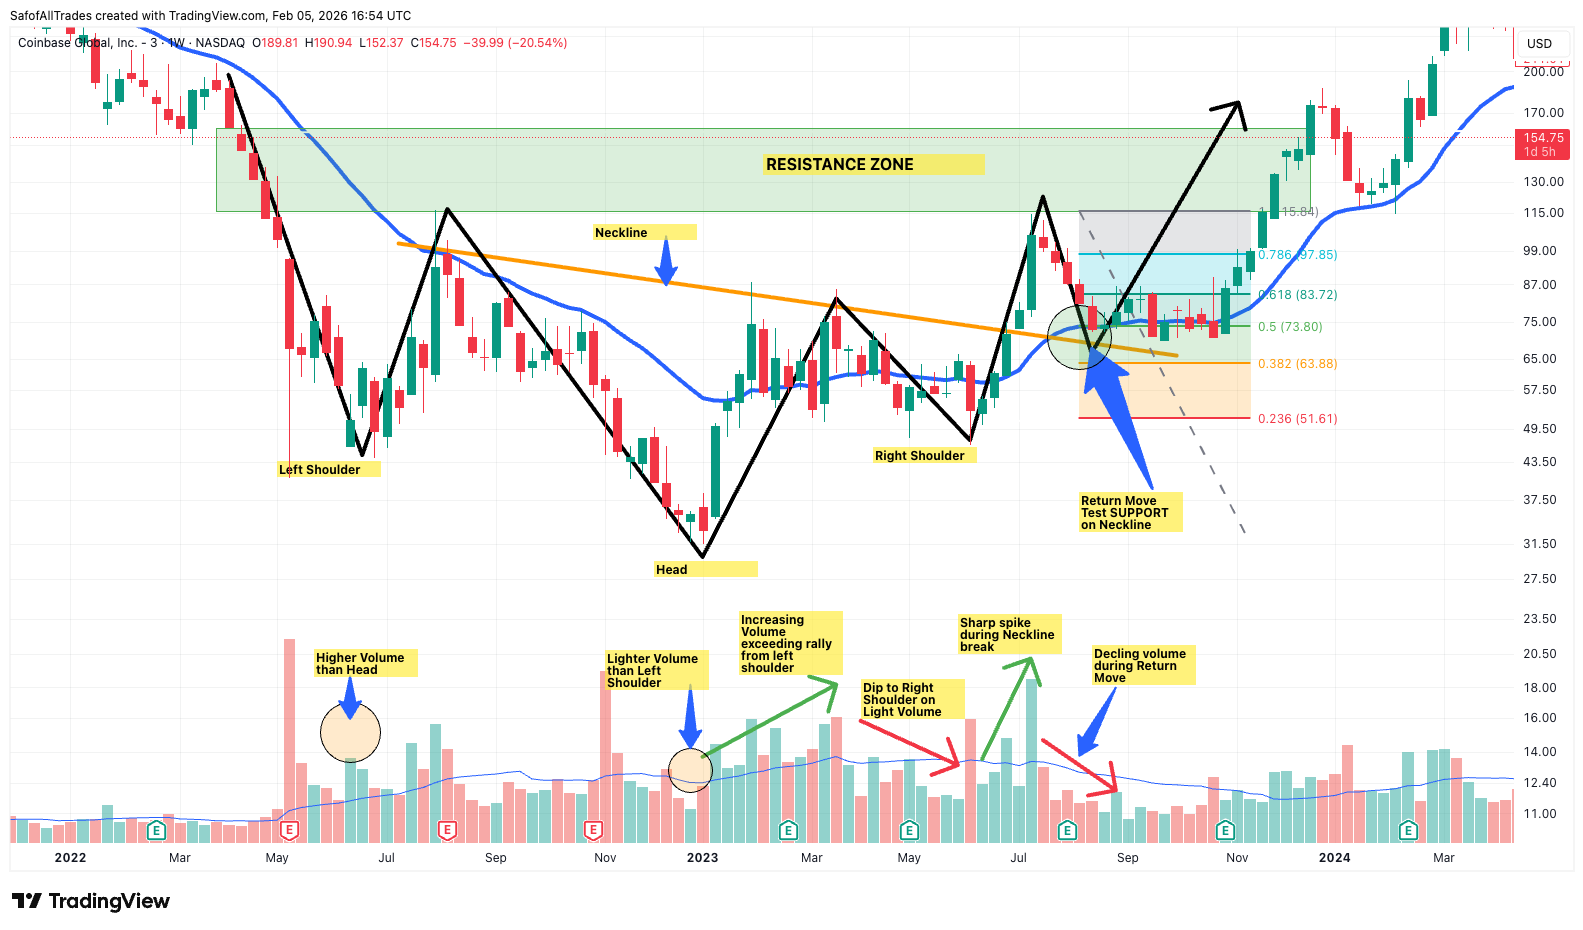
Hi Guys! This is a Technical Analysis of Coinbase (COIN) on the 1 week timeframe.
As you can see we have drawn out a Inverse Head & Shoulder Pattern forming in COIN.
This is a textbook pattern as it follows to the t the necessary criteria both in price action and volume.
Stages of the Price Action
Downtrend to form Left Shoulder
The rally from Left Shoulder does not breach the Neckline
Downtrend from peak of rally to form Head
The rally from the Head also does not breach the Neckline
Downtrend from Peak of rally to form Right Shoulder
The rally from the Right Shoulder breaches the Neckline
A Return move from the breakout back to Neckline -> This stage we are currently playing out
Volume Signs of Textbook Inverse Head & Shoulder
1. Left Shoulder has taller volume bar (higher volume) than Head Volume
2. Lighter volume or shorter bars seen for Head than Left Shoulder
3. The rally from Head to Right Shoulder has increasing volume that exceeds volume of the rally from left shoulder to neckline
4. DOwntrend to Right Shoulder -> shows a declining volume bar height / declining volume
5. Sharp Spike on Volume during rally from Right Shoulder to Neckline breakout
6. Declining Volume during current move, the Return Move
Thoughts:
Both times we rallied from the shoulders we reached a Resistance zone and got rejected.
I believe we are currently in the "Return Move" to test the Neckline as Support
-> The areas i am looking is:
1. 0.5 FIB Level, this is also where the 21 EMA converges so a Support zone to watch
This area is important because it is the "Golden Zone" for FIB, as well as where the 21 EMA is at. This makes this area a place to observe for potential bounce. Though i believe this to be short lived.
2. Testing Support on the NECKLINE SUPPORT line
3. This one is least likely but nevertheless still possible, the 0.382 FIB Level, a potential scenario being a WICK down from testing support on Neckline
After testing these levels i believe that Coinbase will start its Bull run where it has tremendous growth in market cap
A first target would be breaching the Resistance zone and confirming it as Support.
Here’s a link to the original trading view post - proof i observed this before COIN went through its Bull Run.
https://www.tradingview.com/chart/COIN/dXskAe1c-Coinbase-Textbook-Bottoming-Pattern-Found/